Finandy Docs
English
Finandy Docs
English
  • πŸ“ˆManual trading
    • Create order/grid
      • Single order
      • Order grid
      • Fibonacci grid (levels)
      • Order types
        • Limit order
        • Floating order
        • Market order
        • Stop order
        • Trailing order
        • Virtual order
      • Customisable volumes
    • Stop Loss (SL)
    • Trailing Stop (SLX)
    • Take Profit (TP)
    • Settings templates
    • Trade Reports
  • πŸ–₯️Interface
    • User Interface
    • Chart
    • Position list
    • Signal log
    • Other blocks
      • Position settings
      • Market (currency pairs)
      • Order book
      • Notifications
  • πŸ€–Algo-trading
    • TradingView Signals
      • Signal interface
        • Open position
        • Averaging (DCA)
        • Close / Reverse
        • Stop Loss (SL)
        • Trailing (SLX)
        • Take Profit (TP)
      • Connection and configuration
        • Connecting the TradingView indicator or strategy to Binance / OKX
        • Position opening
        • Position Averaging
        • Closing Position
        • Position Reversal
        • Hedging
      • Signal processing logic
      • Signal testing
      • Signal copying
      • Controlling an option in the signal
      • Update settings by signal
      • {{Placeholders}}
      • Common errors
      • FAQ
  • πŸŒ€Copy trading
    • I want to signal (copy trading Binance)
    • I want to copy trades (copy trading Binance)
  • βš™οΈSettings
    • Account
      • Profiles
      • API Keys
      • 2FA
      • Telegram Bot
      • Change password
      • Secret word
      • Sessions
      • Account restart
    • Settings
      • Interface
        • General settings
        • Order creation panel
        • Stop loss (SL)
        • Trailing (SLX)
        • Take Profit (TP)
      • Trading
        • Position price calculation
        • Position PNL Calculation
        • Position Reversal
        • Position Closing
        • Auto-switching from Limit to Stop order
        • Floating order
      • Chart
        • DCAΒ΄s Average line
        • TPΒ΄s Average line
        • Show/hide orders on chart
    • Others
      • Functions
      • FAQ
      • Desktop app for MAC
      • Error codes and solutions
  • πŸ›οΈTrading platform
    • OKX (via API-key)
    • Finandy (exchange)
      • Deposit
      • Transfer between markets
      • Liquidity
      • Withdrawals
      • Trading Fees
      • Account verification
      • API keys
      • About futures
        • Trading Rules
        • Leverage and Margin
        • Differences Between a Perpetual Contract and a Traditional Futures Contract
        • Mark Price in USDβ“ˆ-M futures
        • Liquidation
    • Binanсe (via API-key)
      • Trade via API
      • Adding an API Key
  • πŸ’²Earn
    • Finandy Referral Program
      • Token Bonus
  • πŸ“–Legal
    • Whitepaper
    • Roadmap 1.0
    • Roadmap 2.0
    • Finandy Futures Agreement
    • AML Policy
    • Term of use
    • Chat Rules in Telegram
    • Π‘opy trading terms of use
    • Disclaimer (FIN token)
    • Privacy Policy
Powered by GitBook
On this page
  • Info block above chart
  • Chart
  1. Interface

Chart

βœ” Learn how to use charts on the Finandy platform: setting up timeframes, indicators, and scaling. A detailed guide to TradingView chart functions and tools.

PreviousUser InterfaceNextPosition list

Last updated 10 months ago

Info block above chart

  1. Current price

  2. 24h trading volume for selected pair on chart

  3. 24-hour price change in absolute value and in %

  4. 24-hour maximum value

  5. 24-hour minimum value

  6. Funding, if Futures Market is selected

  7. Token balances for selected pair

  8. Add/remove selected pair from favorites using the button

  9. Selected currency pair icon

Chart

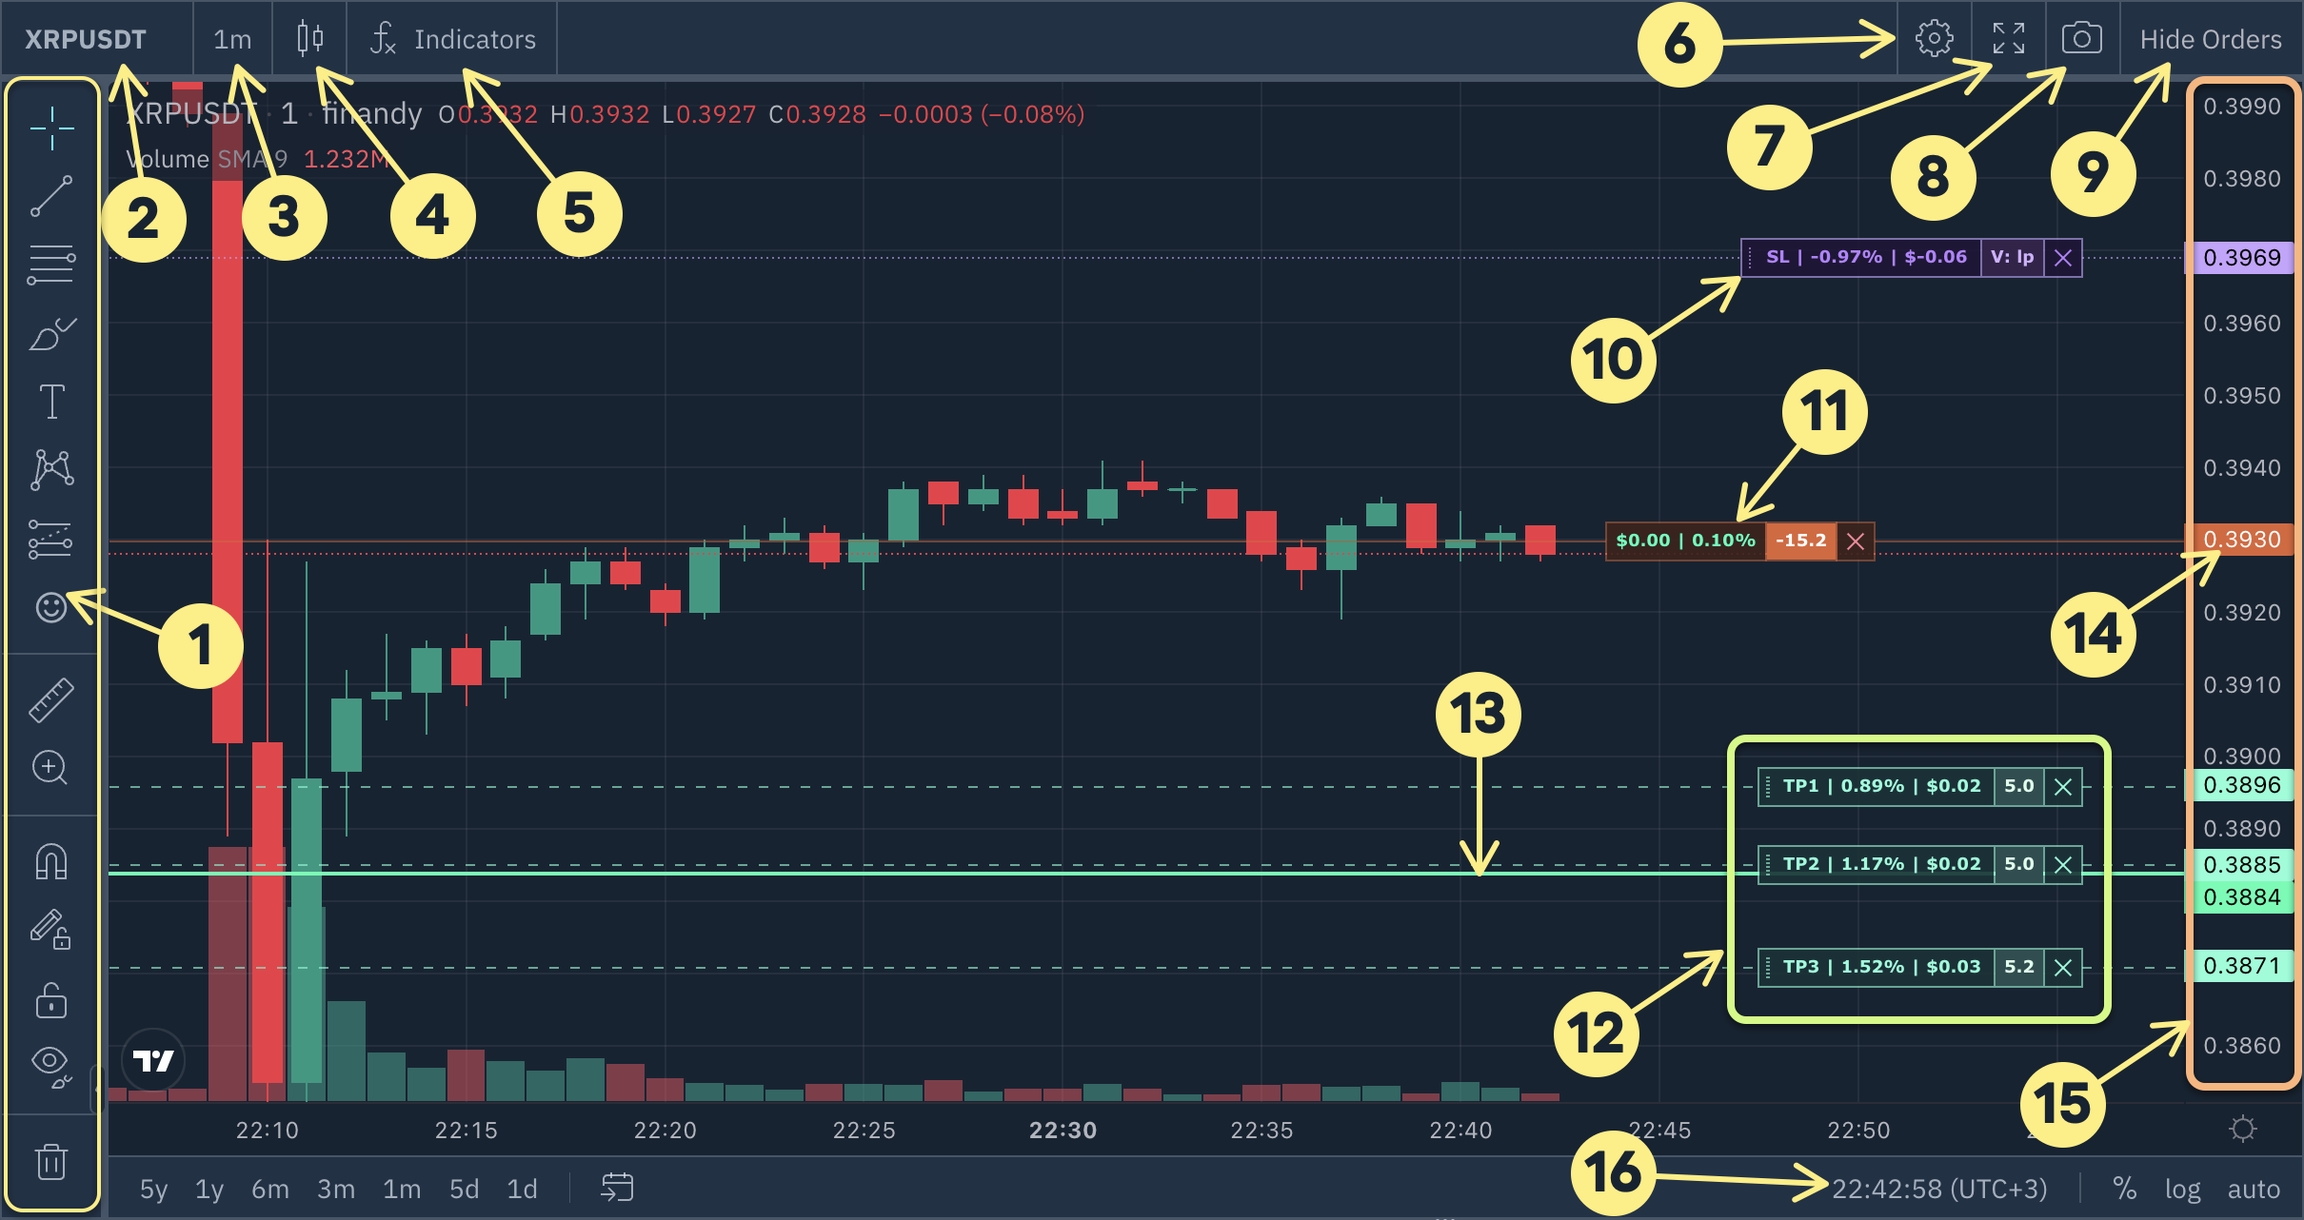
  1. Chart toolbar. TradingView provides the chart widget, which automatically saves drawn lines every 10 seconds. Changes are only saved in the active tab.

  2. Current pair name on the chart. Clicking on the name opens a dialog to select a different currency pair.

  3. Interval (timeframe or candlestick size) for selected pair. You can set the interval by entering numbers from the keyboard.

  4. Chart type. Bars, Japanese candles or just lines.

  5. Indicators. You can add standard indicators to the chart by clicking on the name and accessing the library, which is different from the official TradingView website.

  6. Chart settings. Candlestick colour settings and other custom settings.

  7. Expand the chart to full screen.

  8. Take a chartΒ΄s screenshot.

  9. Hide/Show orders on chart.

13. Average execution price of all TP orders.

14. Currency pair current price.

15. Price scale. To change the chart scale vertically, hold down the left mouse button and drag up or down. To change it horizontally, scroll the mouse wheel on the chart. To change it relative to the mouse cursor, hold down the CTRL button.

16. Current time and time zone. It is possible to change the time zone to your current one.

Do you have any questions? We can help you in our Telegram chat.

10. (SL).

11. Breakeven, including entry and exit fees, is calculated by default. The example shows a Short position.

12. (TP).

πŸ–₯️
Stop Loss
order
Position level.
Take Profit
order
LogoFinandy Exchange + Binance trading terminalTelegram